Empirical SCOTUS: Who’s in the majority?

Although few people ever have the opportunity of sitting on the Supreme Court, some similarities exist between this upper echelon of judging and other jobs. One parallel has to do with job satisfaction. Judges who make it all the way to the Supreme Court should feel accomplished and contented because of their achievements, but there also must be at least a continuum of job satisfaction among the justices. That is not to say that any justice necessarily dislikes the job, just that they may not enjoy it equally either. Measuring job contentment in such a profession without firsthand anecdotal evidence is tricky at best. One thing we do know about the justices that might very well relate to job satisfaction is how often they vote in the Supreme Court’s majority or, conversely, how frequently they are in dissent.
Historically, justices have been in the majority across entire Supreme Court terms. At very least this shows that they were in sufficient agreement with the other justices that they did not perceive the need to voice antipathetic sentiments. There have also been terms when justices have dissented in nearly half of the cases the court heard. This discord with the decision-making engine of the court could well breed frustration with those more often in the majority (note that this is not the only explanation for dissenting behavior). For instance, one of the court’s most frequent dissenting justices of in the past, Justice William Douglas, was described by a former clerk as “a very unhappy man.” The court’s most prolific modern dissenter, Justice Clarence Thomas, has also made some waves with positions he advanced in recent cases.
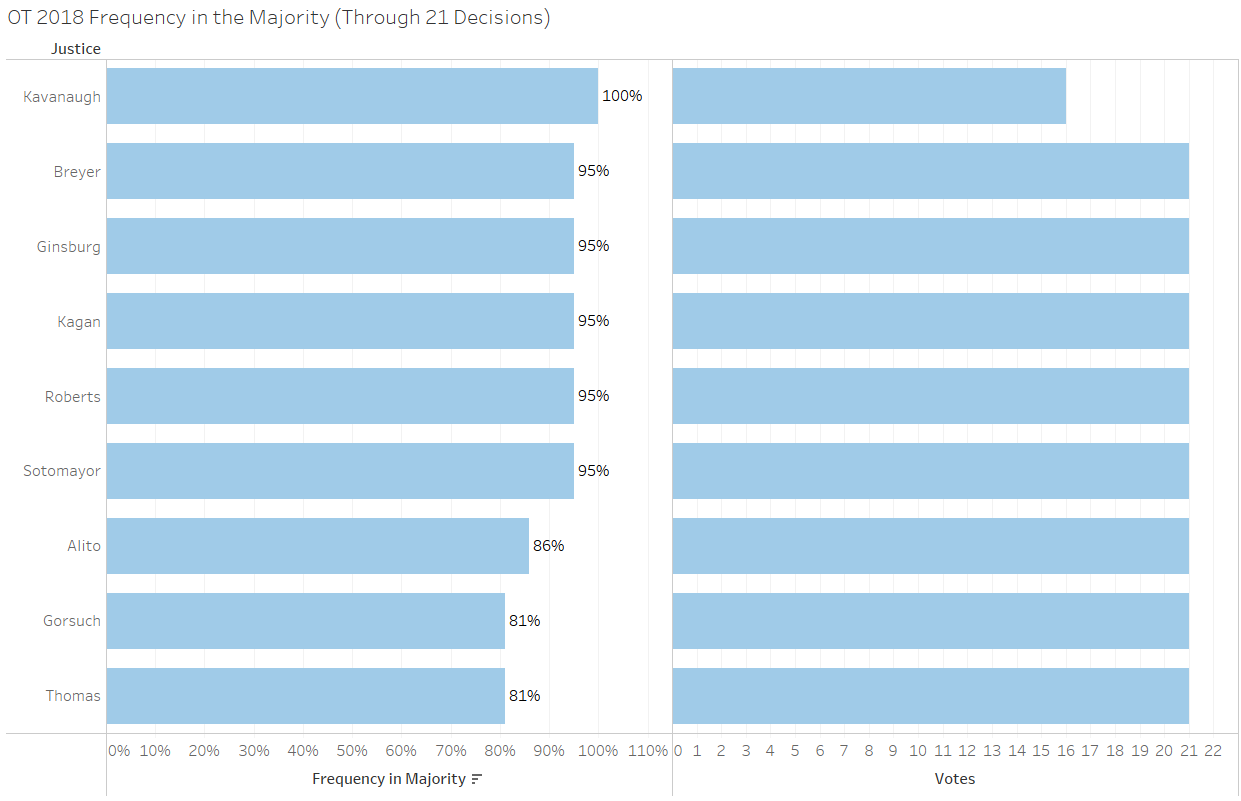
Justices typically vote in the majority much more frequently than these two outlying justices. So far this term the justices’ frequencies in the majority range from 81 percent to 100 percent (Frequency in the majority in the graph below is shown on the right and the number of votes composing this measure is shown on the left.).
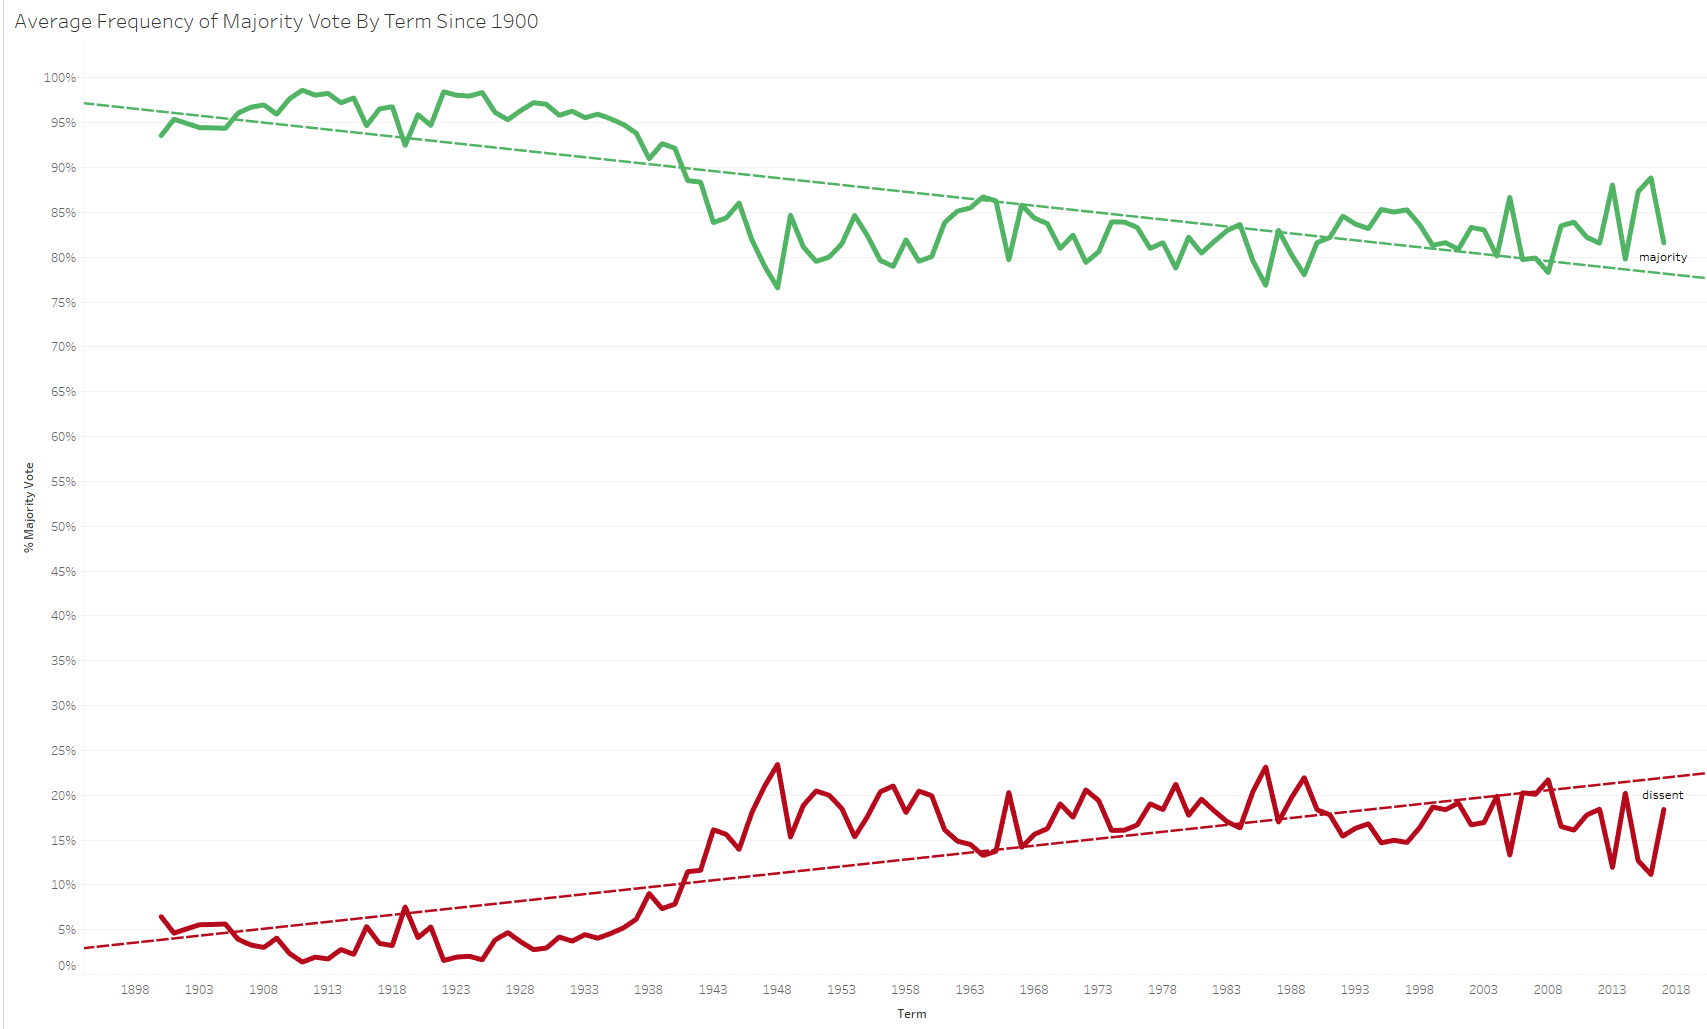
How does this stack up to justices in years past? In recent terms justices have ranged from 97 percent frequency in the majority (Justice Anthony Kennedy in October Term 2016) to 61 percent in the majority (Thomas in October Term 2014). Although Kennedy’s 97 percent is quite high, and the justices still often reach many unanimous decisions every term, justices now typically don’t vote in the majority as frequently as they did in the past. When we look at the justices’ frequencies of voting in the majority in argued cases since 1900, we see a clear dip over time.
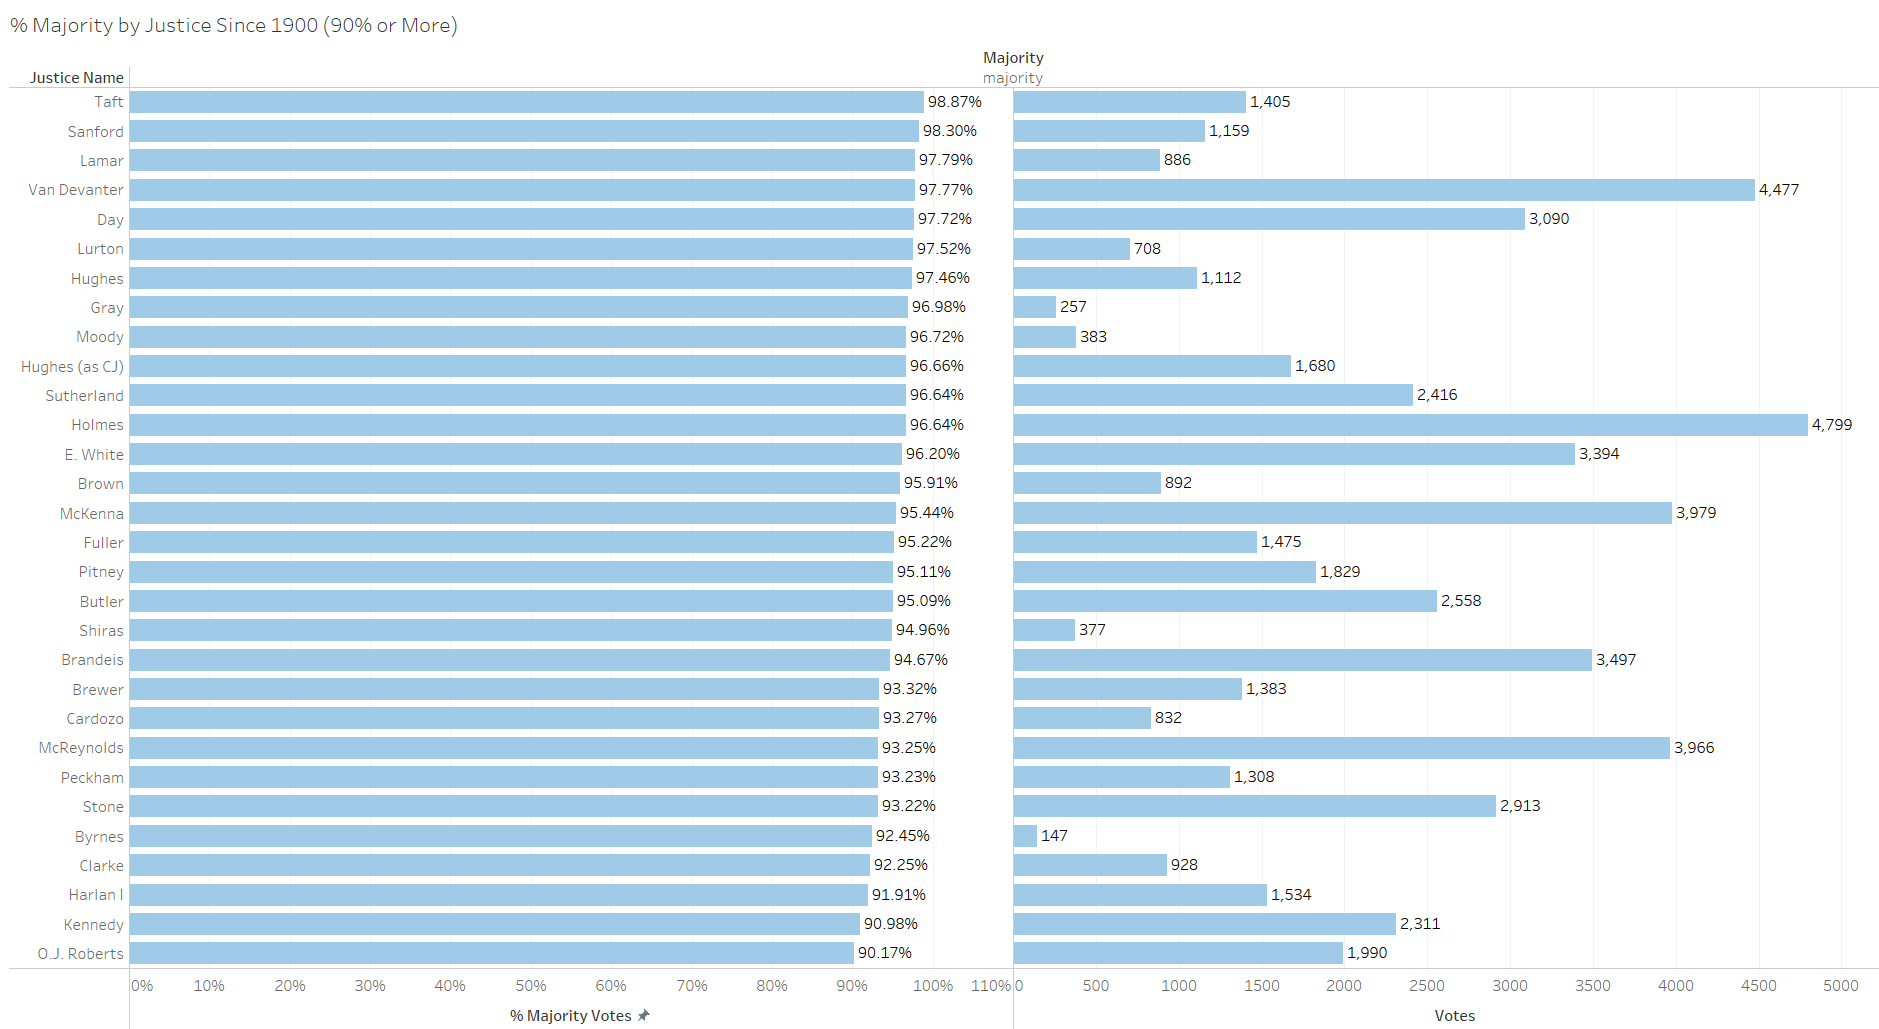
Whatever led to the past high level of consensus no longer holds quite as true. This is particularly evident across justices’ career votes. When we look at justices who voted in the majority at least 90 percent of the time through their careers since 1900, Kennedy is the only modern justice who makes the list. In fact, aside from Kennedy, all the justices who made this list sat on the Supreme Court prior to 1950.
Several reasons likely exist for the differences in frequencies in the majority from past terms to now. Along with the past norm of consensus, the justices may not have had as complex and divisive cases when much of their jurisdiction was mandatory. In the past, the justices have voted almost unanimously across entire terms. The highest average frequency in the majority across the Supreme Court in a term since 1900 was in 1911, when the average frequency in the majority was 98.3 percent (Averages are shown in gray lines overlaying the bars.).

Justice William Day’s 100 percent frequency in the majority was not unique, because several justices had as high a frequency for a term in the same era. The closest the court has come to this level in recent years was during the 2016 term (when Kennedy was in the majority 97 percent of the time).
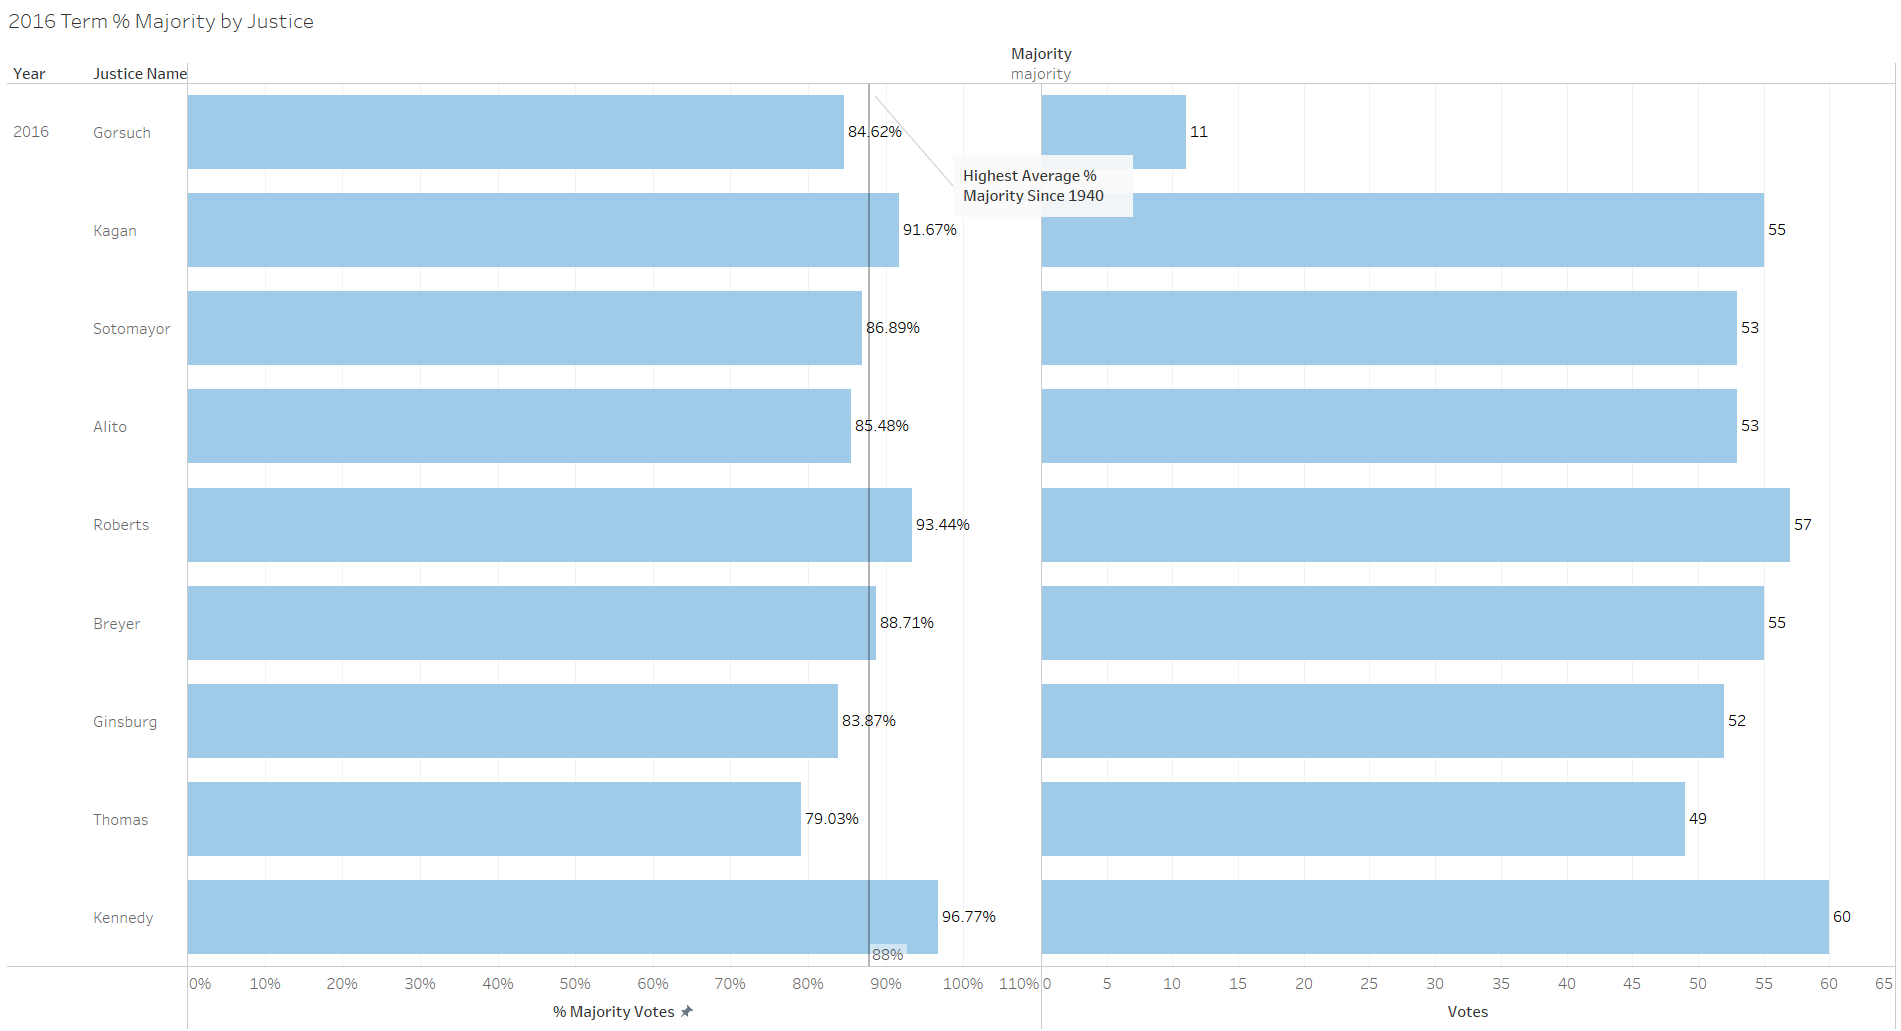
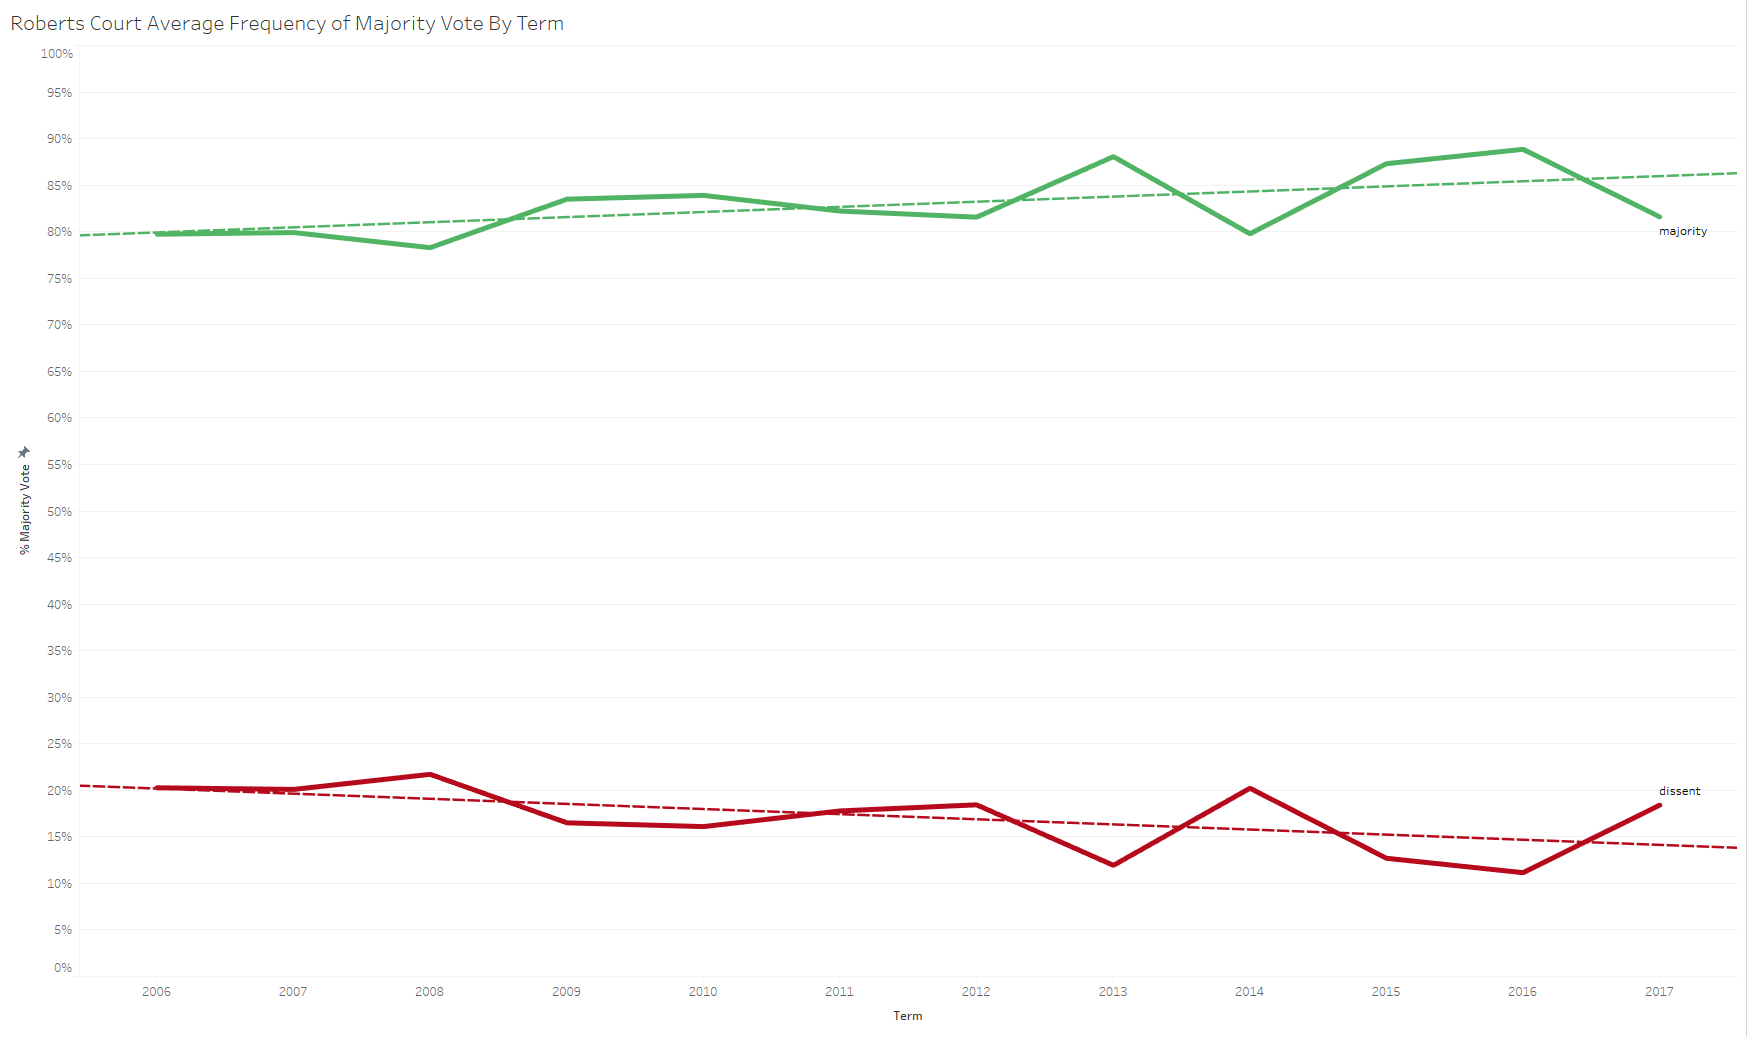
One caveat to this figure is that the high level of consensus may have to do with the fact that, because Justice Neil Gorsuch only sat on the court for the April oral argument session, the court was composed of only eight justices for most of the term. Still, when we focus on the years since John Roberts took over the post of chief justice, we see a consistent average frequency in the majority across justices of 80 percent that even rises a bit from 2005 through 2017.
Justices are typically much more often in the majority than they are in dissent, even in recent years. Kennedy’s high frequency is still an anomaly, however. His role as swing justice may well have contributed to this. When we look at justices who have had a frequency in the majority of at least 94 percent for a term since 1950 (with five votes or more in a term), we find only two justices from recent courts: Kennedy and the other swing justice of recent years, Justice Sandra Day O’Connor.
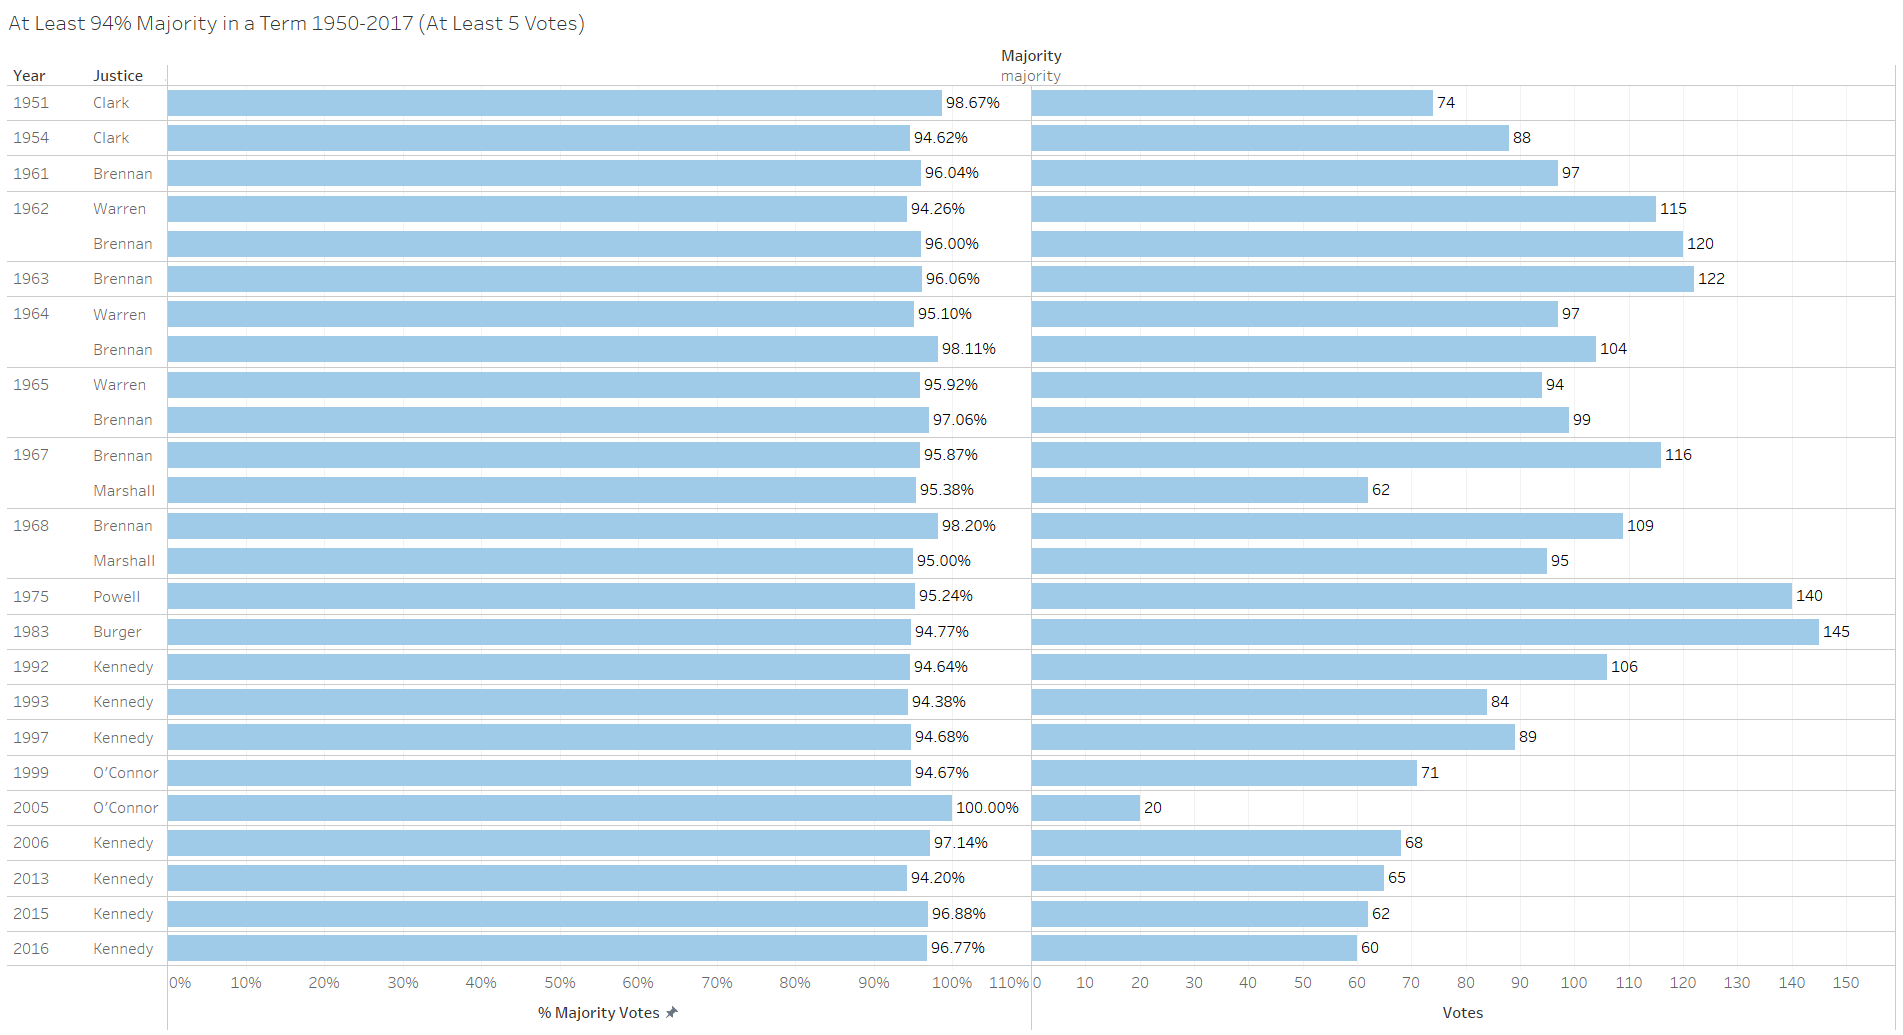
Interestingly, although the court is well known for its conservative majorities, the instances in this chart in which two justices had frequencies in the majority of 94 percent or more in the same term were all permutations of the liberal justices from the Warren Court years – Chief Justice Earl Warren and Justices William Brennan and Thurgood Marshall.
Justices at the opposite end of the spectrum tend to cluster together as well. Looking at the lowest frequencies in the majority by term since 1900, justices from the Vinson Court (1946-1953) take the cake. The lowest overall average frequency in the majority for a term since 1900 was in 1948, when the justices voted on average 76 percent of the time in the majority.
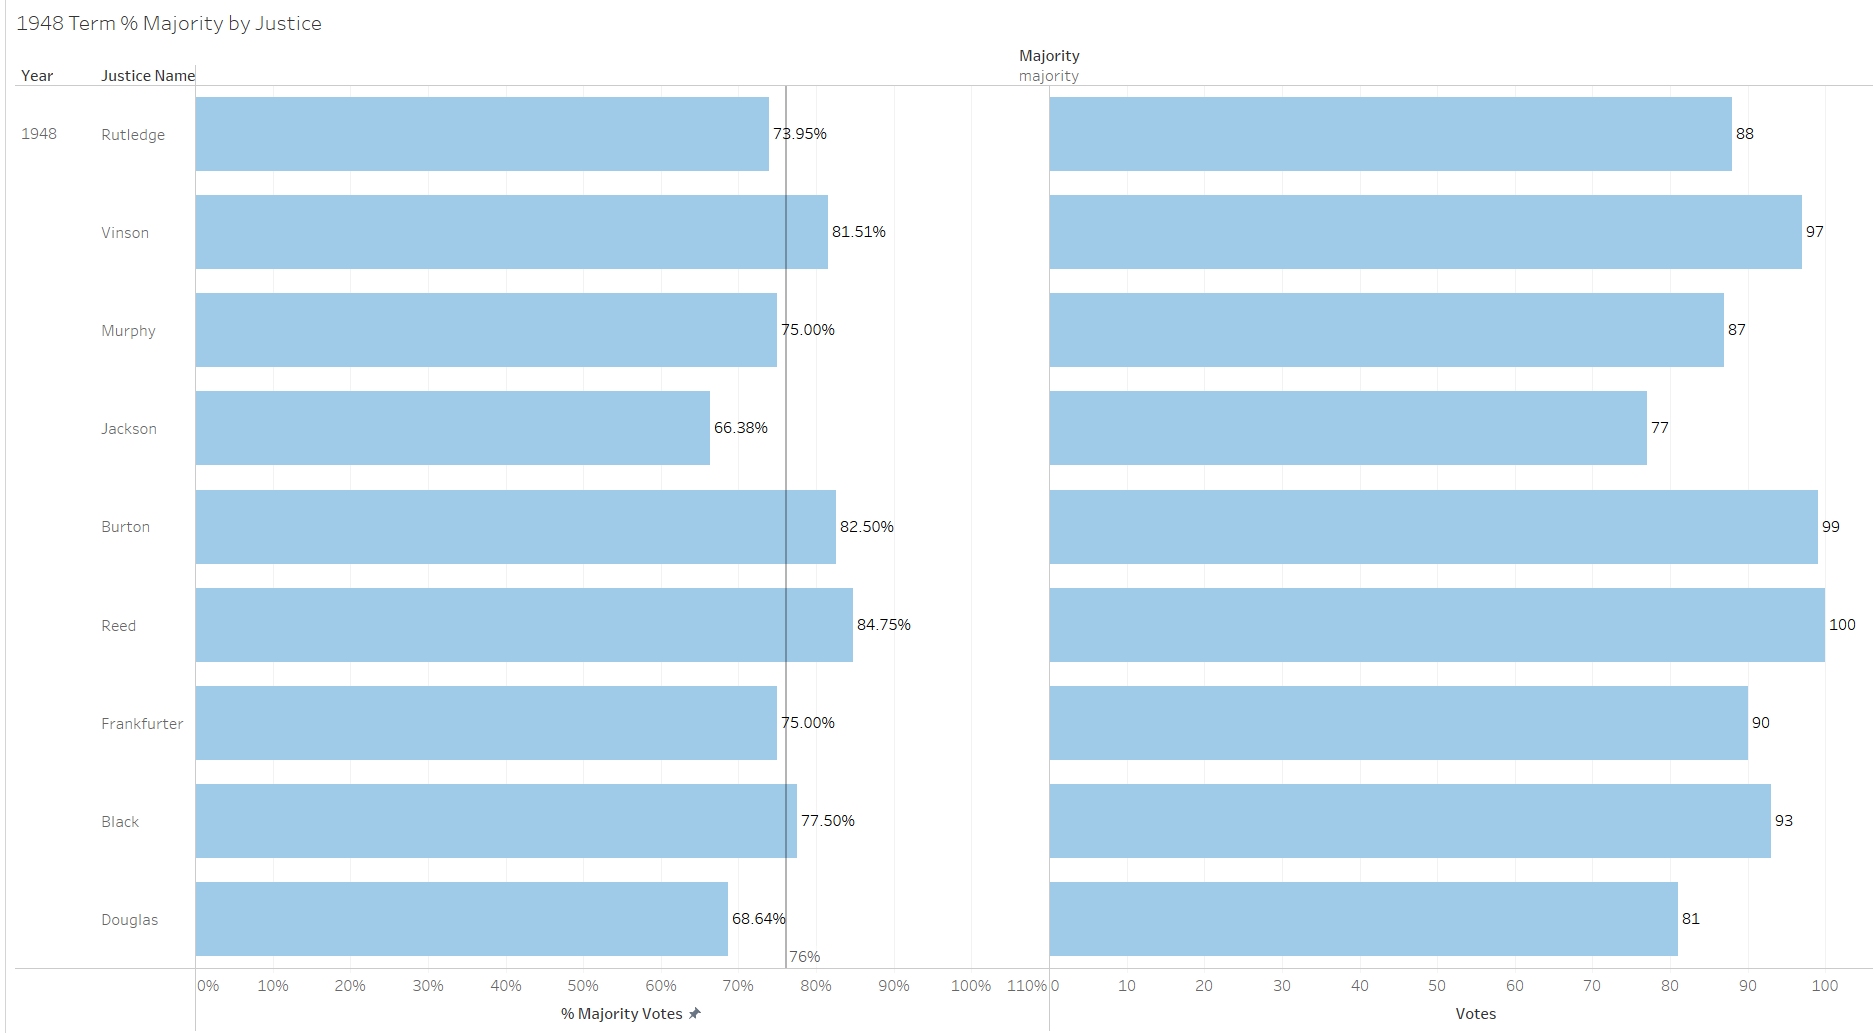
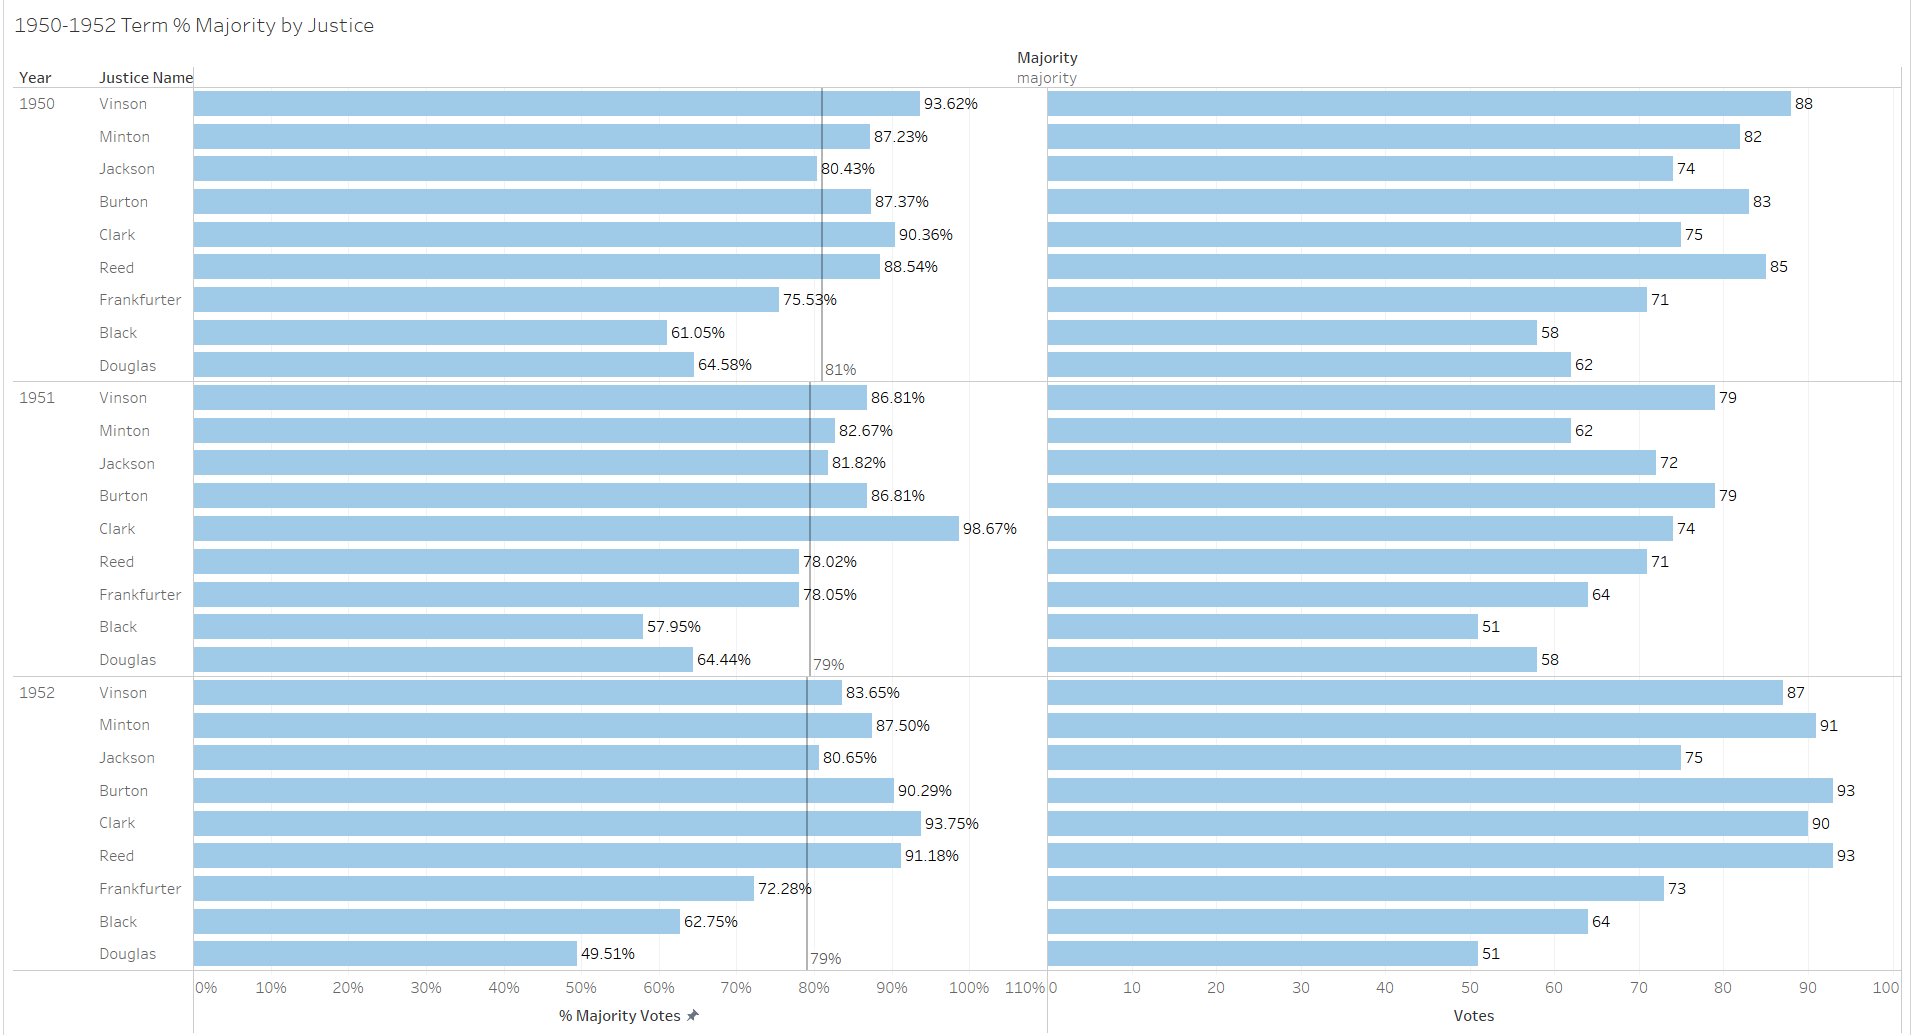
Several of the justices that term had frequencies below 70 percent, with Justice Robert Jackson the lowest at just over 66 percent. Douglas had the lowest frequency in the majority across an entire term, with his 49.51 percent in 1952. When looking at the frequencies across justices for the 1950-1952 terms, we can see a considerable difference from the high frequencies discussed earlier in this post.
Looking at justices with the lowest career average frequencies in the majority yields somewhat of a different picture. Rather than featuring predominantly Vinson Court justices, this figure shows that many of the justices with career lows are actually from the current court or recent courts.
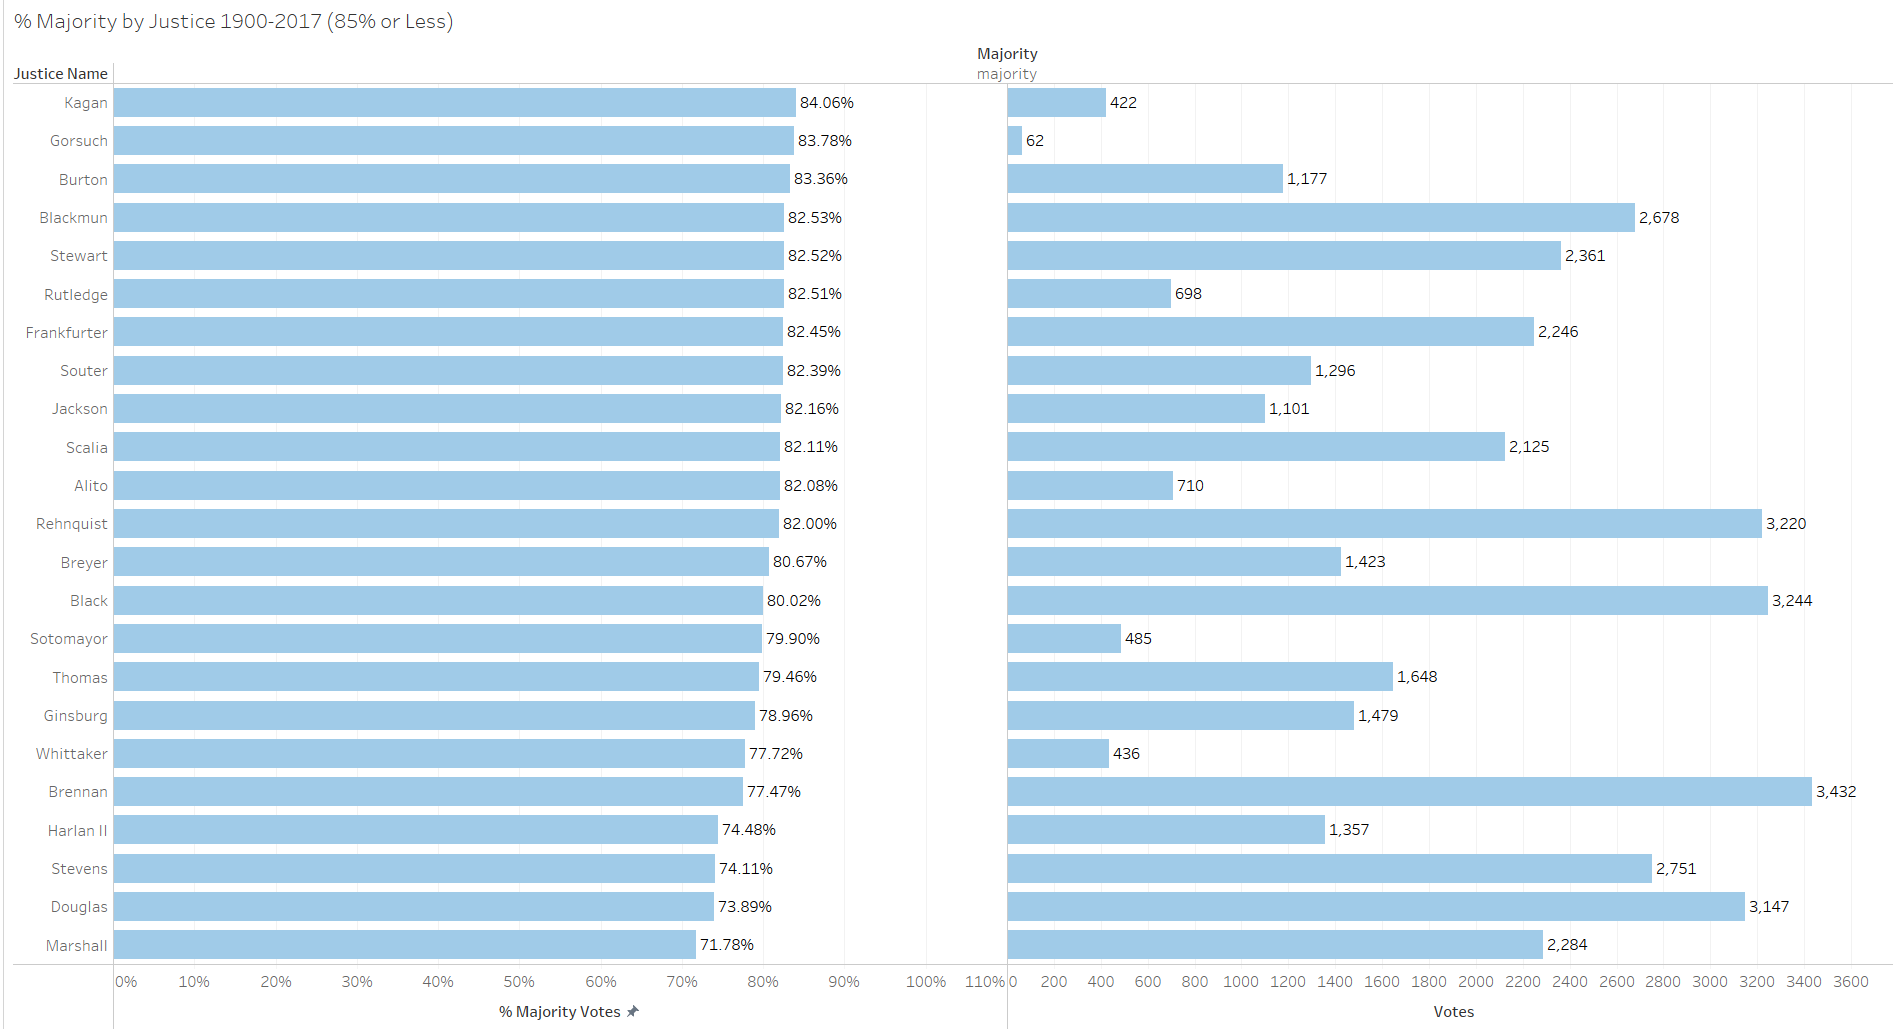
Some of this may have to with the fact that the current justices’ averages, especially Gorsuch’s, typically are based on a smaller sample of votes and are to this point incomplete. That said, Chief Justice William Rehnquist and Justices John Paul Stevens, David Souter and Antonin Scalia all left the court after the year 2000 and are on this list. Also, Thomas’ and Justice Ruth Bader Ginsburg’s frequencies are based on over 1,000 votes apiece. This hints at the significance of the decline in the overall average frequency in the majority by term since 1900, as depicted in the second figure in the post.
A question that this decline presents is whether this trend will continue. Although the numbers for the 2018 term do not hint at this so far, they are unlikely to continue along these lines for the remainder of the term. First off, the justices tend to hear more divisive cases later in the term. That is where we generally see the bulk of 5-4 splits and many of the resounding decisions from recent terms (think Obergefell v. Hodges, Burwell v. Hobby Lobby Stores Inc., Fisher v. University of Texas at Austin, etc.). Secondly, the Supreme Court is potentially ideologically split like never before. Although Roberts has done a good job of uniting in the court’s more conservative and liberal wings in the court’s argued decisions so far this term, inevitably we will see many more fractured decisions, which will tell us quite a bit about the future direction of the court.
This post was originally published at Empirical SCOTUS.
***
Past cases linked to in this post:
Burwell v. Hobby Lobby Stores, Inc., 134 S. Ct. 2751 (2014)
Fisher v. Univ. of Tex. at Austin, 136 S. Ct. 2198 (2016)
Obergefell v. Hodges, 135 S. Ct. 2584 (2015)
Posted in Empirical SCOTUS